
How to Budget for a Wedding
The direct answer: split your total using a percentage-allocation framework, venue and catering first, then work outward. Here is the exact framework, real 2026 cost data, and a worked example.
Try the Free Budget AllocatorDecide your total budget first, then allocate it by category using the ranges wedding-planning guides like The Knot and WeddingWire publish: roughly 40-50% to venue, catering and bar; 10-12% to photography and video; 8-10% to flowers and decor; 5-10% to entertainment; 5-8% to attire; and a 5-10% contingency buffer for the unexpected. Book venue and catering first since they anchor every other decision, then fill in the rest by priority.
The Long Answer
"How to budget for a wedding" is the single most searched wedding question of the past 12 months, according to 24fingers' 2026 wedding search trends analysis. That makes sense: couples are not looking for inspiration boards at this stage, they are looking for infrastructure, a repeatable method for turning one lump-sum number into a plan that will not blow up three vendor contracts in.
The method that works is percentage-based allocation. Instead of guessing a dollar figure for each category, you assign each one a share of your total. This keeps the categories that are structurally large (venue, catering) funded before the categories that are easy to overspend on because they feel fun to shop for (flowers, favors, stationery).
The Percentage-Allocation Framework
Ranges reflect current wedding-planning industry consensus (WeddingWire, Minted, TheWeddingPlanner.ai). Apply them to your real total, then nudge based on what matters most to you.
| Category | Share of Budget | Why |
|---|---|---|
| Venue, catering & bar | 40-50% | The largest and least flexible category. Anchors everything else. |
| Photography & video | 10-12% | The one purchase that outlasts the wedding day itself. |
| Flowers & decor | 8-10% | Highly compressible with silk blends, seasonal blooms, or venue-provided florals. |
| Entertainment / music | 5-10% | DJ vs live band is the biggest swing factor in this line. |
| Attire & beauty | 5-8% | Dress, suit, alterations, hair, makeup for both partners. |
| Contingency buffer | 5-10% | Gratuities, overages, last-minute additions. Almost always gets spent. |
A Worked Example (Illustrative)
Applying the framework above to The Knot 2026 Real Weddings Study national average of $34,200. This is a labeled illustrative example, not a prediction of your costs.
Source: The Knot 2026 Real Weddings Study, 10,474 US couples married in 2025.
Want this calculated for your exact total? The free Budget Allocator does this math automatically and lets you drag categories to fit your priorities.

First dance
You guys!!
Budget mapped. Now protect what it paid for.
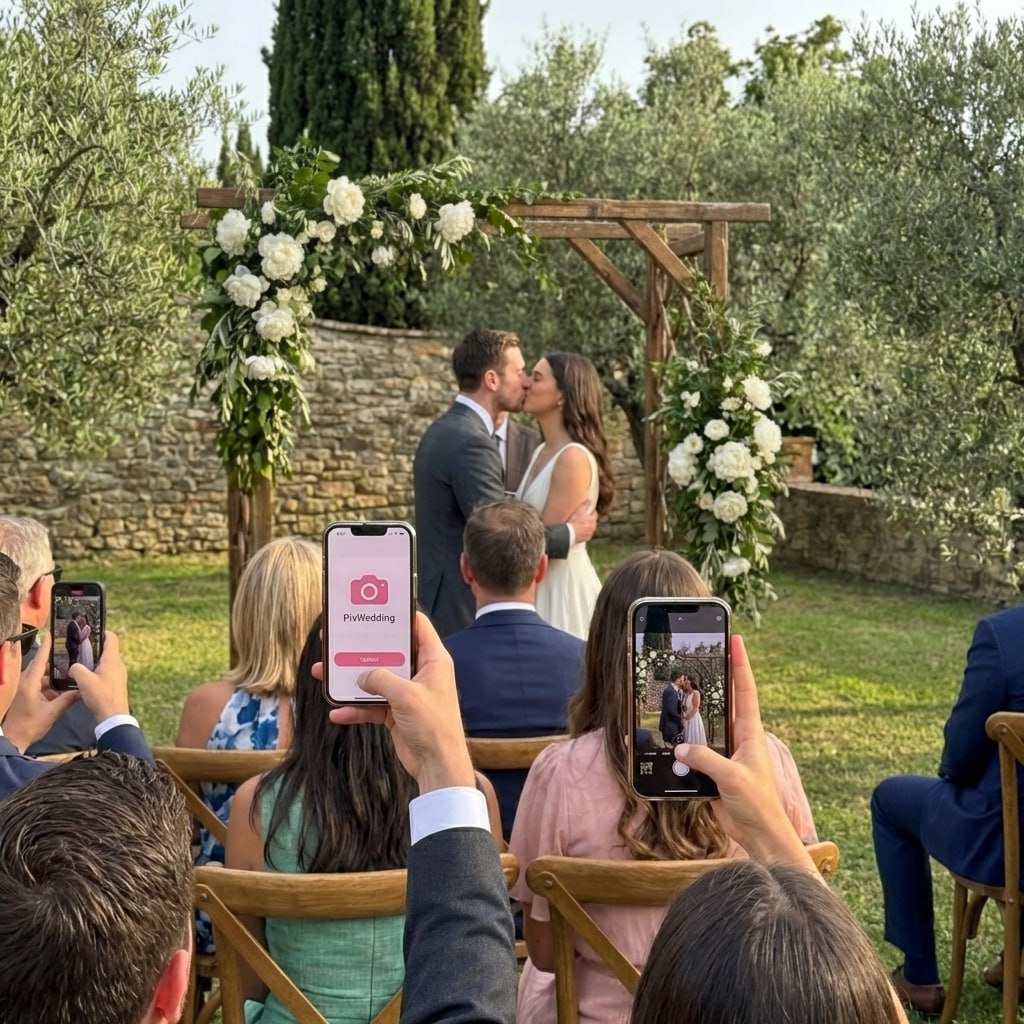
Every dollar in that spreadsheet buys a moment. A free Pix Wedding QR album makes sure your guests' phones capture every one of them, not just the photographer's booked hours.
From Mom
Scan to join the album
No app, no account
UPLOADING
Saving your moment
THE ALBUM
Emma & Jack
June 21, 2026
647 photos · 95 guests


SCAN TO TRY
pix.wedding/
your-wedding
Build Your Budget in 8 Steps
Follow this order and every category gets funded from the real total, not from guesswork.
- 1Set the real total firstAdd up every contribution (yours, your partner's, family gifts) into one honest number before you look at a single vendor. This is the number the whole framework works from.
- 2Subtract your contingency buffer off the topTake 5-10% off the total and set it aside mentally before allocating anything else. Budget the remaining 90-95% as your working total so the buffer is protected, not the first thing that disappears.
- 3Lock venue and catering firstBook the category that eats 40-50% of your budget before committing to anything smaller. Every other decision, guest count, season, formality, flows from this choice.
- 4Assign photography and video nextAt 10-12%, this is the second-largest flexible category and the one purchase you will still value in 20 years. Underfunding it to pay for flowers is the most common regret couples report to planners.
- 5Fill in the mid-tier categories by prioritySplit flowers, entertainment, and attire using the ranges above, then nudge 2-3 points toward whichever one matters most to you as a couple. This is where personal taste should override the default split.
- 6Build the smaller line items lastStationery, favors, transportation, and rings usually total under 10% combined. Budget them after the big categories so they do not quietly eat funds meant for photography or catering.
- 7Track every deposit against the planUse a live spreadsheet or the Pix Wedding Budget Allocator to log deposits as they happen. A framework only works if you check actual spending against it monthly, not just once at the start.
- 8Revisit after the guest list is finalGuest count is the single biggest lever on catering and venue cost. Re-run your allocation once RSVPs are in, because per-guest costs (about $292 on average nationally) compound fast.
Where Couples Overspend
Six mistakes that quietly break a budget that looked fine on paper.
Signing a venue contract before you have subtracted a contingency buffer and priced catering separately is how couples end up 20% over budget by the time the DJ is booked.
Nearly every couple spends their buffer, on gratuities, extra alterations, a last-minute rental, or overage fees. Budgeting 0% for the unexpected guarantees you will pull from another category.
Flowers are the most compressible category on this list; photography and video are permanent. Cutting the wrong one to fund the wrong one is the single most-regretted swap couples report.
At a national average of about $292 per guest, adding 20 names to the list after the budget is set can add roughly $5,800 you never planned for. Finalize the guest list before finalizing catering numbers.
An even 10% across ten categories ignores that venue and catering are structurally larger than favors. Percentage ranges exist because categories are not equally sized by nature.
A $20,000 wedding for 60 guests and a $20,000 wedding for 180 guests are not the same plan. Always normalize to cost-per-guest before comparing notes with other couples.
Percentage Framework vs. Priority-Tier Budgeting
Percentage Framework
Assign fixed ranges to each category based on typical proportions.
- Pro: Prevents underfunding structurally large categories like venue and catering
- Pro: Fast to apply, works before you have quoted a single vendor
- Con: Generic ranges do not reflect a couple who cares far more about one category than another
Priority-Tier Budgeting
Rank categories by personal importance and fund the top tiers first.
- Pro: Reflects what you actually value, not an industry average
- Pro: Good fit for couples with one non-negotiable priority
- Con: Easy to underfund unglamorous but unavoidable categories, taxes, gratuities, alterations
Most couples do best with a hybrid: start from the percentage framework, then shift 3-5 points from a low-priority category into a high-priority one.
Real 2026 Spending by Budget Tier
From The Knot 2026 Real Weddings Study: what couples in each self-reported budget range actually spent.
| Self-reported budget range | Average actual spend |
|---|---|
| $0 - $15,000 | $8,900 |
| $15,001 - $40,000 | $26,400 |
| $40,000+ | $70,300 |
Source: The Knot 2026 Real Weddings Study, 10,474 US couples married in 2025. Couples in every tier tend to spend below their stated ceiling once vendors are actually booked.
A Worked Scenario: Two Priorities, One Budget
The following is an illustrative example, not a real couple, built to show how the framework flexes around personal priorities while staying inside a $34,200 total.
Say a couple values photography enormously (a family member is a wedding photographer's biggest advocate) but does not care much about flowers. Starting from the default framework (11% photography, 9% flowers), they shift 4 points from flowers into photography: flowers drops to 5% ($1,710), photography rises to 15% ($5,130). Every other category, and the total, stays exactly the same. That is the entire mechanism: move points between categories, never invent new money.
The same logic applies to entertainment vs favors, attire vs transportation, or any other pair. The framework is a starting proportion, not a ceiling.
When to Lock Each Category
A month-by-month sequence for turning the framework into actual bookings, working from the largest category down to the smallest.
Why Your City Changes the Percentages, Not the Framework
The Knot 2026 Real Weddings Study national average of $34,200 masks significant regional variance. Metro areas with a higher cost of living, major coastal cities in particular, tend to see notably higher venue and catering costs per guest, which can push that category above the 50% mark even when every other category stays proportionally similar.
The fix is not a different framework, it is the same framework applied to your regional total instead of the national one. Use our wedding cost calculator by city to find a more accurate regional starting number before you apply the percentage splits above.
Are You Ready to Allocate? Self-Check
Checked every box? Run your real numbers through the free Budget Allocator next.
Budget Terms, Explained
A budgeting method that assigns each spending category a proportion of the total budget (rather than a flat dollar guess), so the largest, least-flexible costs are funded first.
A reserved 5-15% of the total budget held back for gratuities, overages, and last-minute additions, rather than spent on planned categories.
Total wedding spend divided by guest count. The Knot 2026 Real Weddings Study puts the national average at about $292 per guest, useful for comparing budgets fairly across different wedding sizes.
An alternative method where couples rank categories by personal importance and fund the top tiers first, rather than following fixed percentage ranges.
A budget line that can shrink significantly without changing the wedding's core experience, such as flowers, favors, or stationery, as opposed to structural costs like venue and catering.
Typical Vendor Payment Schedule
Deposits and installments hit at different points than the allocation itself. Build these dates into your budget timeline so cash is available when contracts require it, not just when the category is planned.
| When | Typical payment |
|---|---|
| At contract signing | 25-50% deposit for venue and major vendors (photographer, caterer, band) |
| 6 months out | Second installment on venue contracts, often 25% |
| 30-14 days out | Final headcount and balance due for catering, most contracts lock the guest count here |
| Day of | Gratuities in cash envelopes for vendors, pulled from the contingency buffer |
Exact terms vary by contract. Confirm each vendor's schedule in writing before the allocation framework is finalized.
National average wedding cost, The Knot 2026 Real Weddings Study (10,474 couples).
Average cost per guest nationally, same study. Multiply by your final headcount.
Average guest count in the 2026 study, down from 131 pre-pandemic in 2019.
Typical share of total budget consumed by venue, catering, and bar combined.
A Few More Questions Couples Ask
Should family contributions change how I allocate the budget?
No. Contributions change your total, not your proportions. Add every contribution into one honest number first, then apply the same percentage framework regardless of who is paying for which category.
What if my venue already includes catering in one price?
Treat the bundled venue-plus-catering price as the full 40-50% category. Do not budget catering separately on top of it, that is the most common double-counting error in DIY spreadsheets.
Can I skip the contingency buffer if I am disciplined?
Discipline does not prevent vendor overages, extra alterations, or gratuities you forgot to plan for. The buffer is not about trust in your own spending, it accounts for costs that only appear once contracts are signed.
Related Budget Guides
Sources
- 24fingers, "Wedding Search Trends 2026", the 12-month top-searched-question data.
- The Knot, "Average Wedding Cost" (2026 Real Weddings Study), national average, cost per guest, and budget-tier data.
- WeddingWire, "A Wedding Budget Breakdown by Percentages", category-percentage ranges referenced in this framework.
Why Percentage-Based Budgeting Beats a Flat Wish List
Most couples start wedding budgeting the wrong way: they list every category they can imagine (venue, flowers, band, photographer, favors, welcome bags) and assign a number to each based on gut feeling. The problem is that gut-feeling numbers rarely add up to the total you can actually afford, and by the time you notice, you have already signed a venue contract.
Percentage-based budgeting works backward from your real total. You decide the number first, then let proportions (not vibes) tell you what each category gets. It keeps the largest, least-flexible costs, venue and catering, funded first, and treats everything else as the remainder to be allocated by your actual priorities.
Where This Guide Fits Next to Our Other Budget Content
Pix Wedding has two other budget guides, and each answers a different question. This page answers "how do I split my budget into the right categories." Our how to plan a wedding on a budget guide answers "how do I spend less overall," with sub-$10K tactics and vendor-negotiation scripts. Our wedding budget guide answers "what does a realistic wedding cost at my size," with tiered examples from $5K to $50K+.
Read this page first to build the allocation framework, then use the frugal guide if your goal is cutting the total, or the tiered guide if you want to see what a comparable wedding actually costs at your target size.
Explore more free wedding tools
Everything you need to make your wedding day stress-free and unforgettable.
Cost Calculator
Compare wedding costs by city.
Budget Allocator
Turn your total into a category-by-category plan.
Courthouse Wedding Cost
Real fees by county and what to expect.
Photo Sharing QR
The best way to collect guest photos.
Wedding Checklist
Month-by-month planning checklist.
AI Vow Generator
Write "banger" vows in seconds.
AI Speech Pro
Banger toasts for Best Man & more.
Wedding Budgeting: Common Questions
Everything you need to know about our free tools and how they help your wedding day.
Start with your total number (what you and any contributors can realistically spend without debt), then split that number across categories using a percentage framework: roughly 40-50% to venue and catering, 10-12% to photography and video, 8-10% to flowers and decor, 5-10% to entertainment, 5-8% to attire, and a 5-10% contingency buffer. Lock in venue and catering first since it anchors everything else, then work outward.
Venue alone (excluding catering) typically runs 10-15% of the total budget when catering is billed separately, but venue plus catering plus bar service combined usually consumes 40-50% of the total, making it by far the largest line item.
According to The Knot 2026 Real Weddings Study, which surveyed 10,474 US couples married in 2025, the national average wedding cost is $34,200, with an average cost per guest of $292 and an average guest count of 117.
Most wedding-planning guides recommend a contingency buffer of 5-15% of your total budget for gratuities, last-minute additions, alterations, and vendor overages. Treat this as a real line item from day one, not an afterthought, since almost every couple spends it.
Yes. This framework is about how to split whatever total you have across categories in the right proportions, at any budget size. If your goal is specifically to spend less overall, see our dedicated guide on how to plan a wedding on a budget for frugal tactics and sub-$10K strategies.
Percentages are a strong starting point, not a rulebook. If photography matters more to you than flowers, shift 3-5 points from decor into photography. The framework exists to stop you from underfunding the big, hard-to-cut categories (venue, catering) while overspending on small, easy-to-inflate ones (favors, stationery).