Wedding Photography Statistics 2026: 60+ Numbers Couples Should Know
From cost benchmarks and hiring rates to photo volumes, sharing trends, regret data, and country averages - every key number in one place.

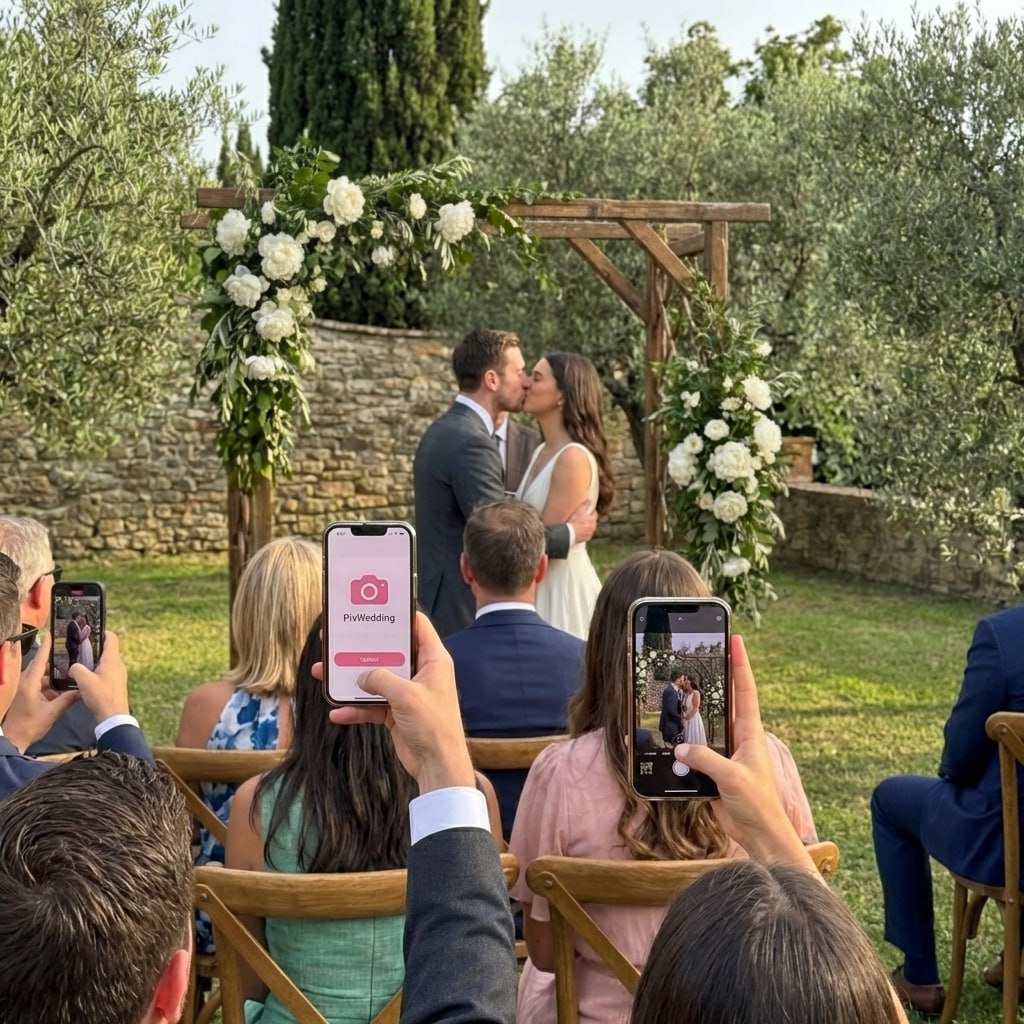
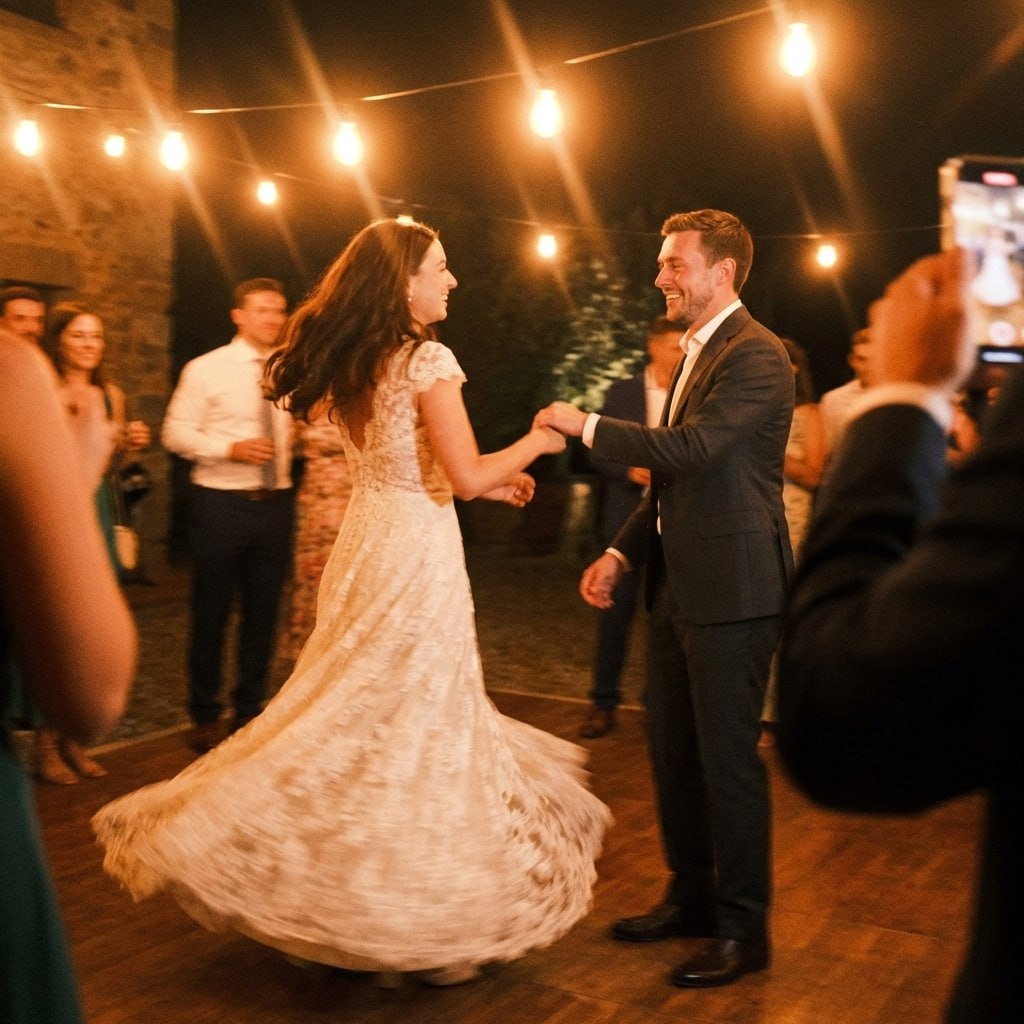
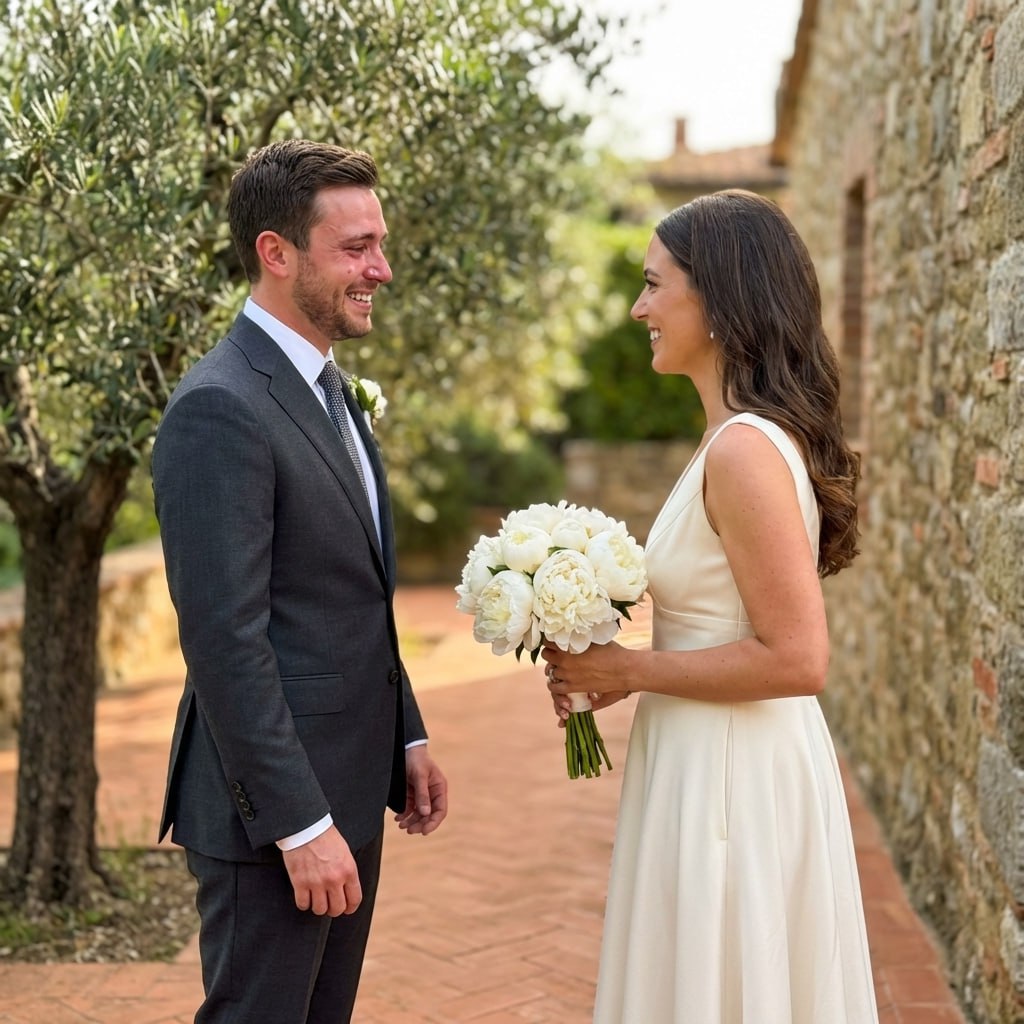
First dance
You guys!!
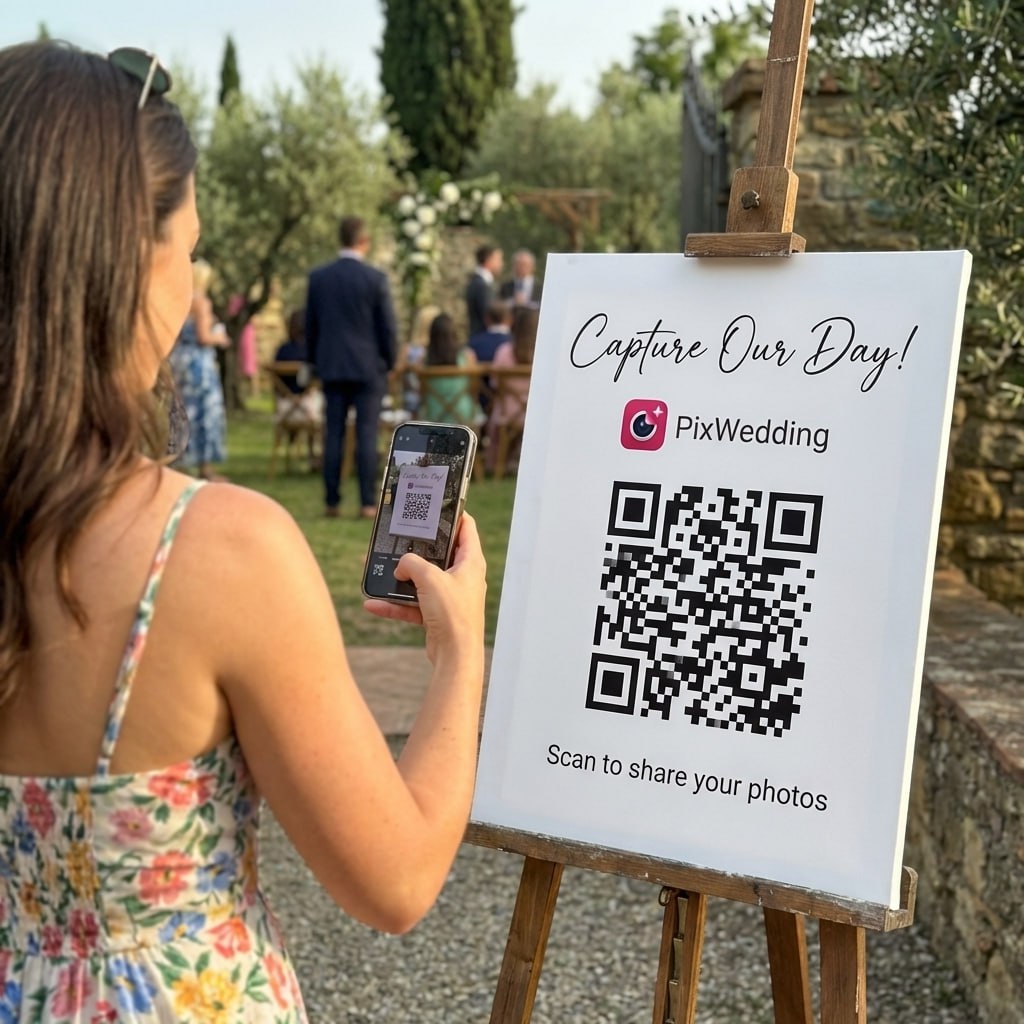
The stat that matters most: did you get the photos?
A QR code on the tables is the easiest way to collect the guest photos your photographer never sees. Set yours up free in a couple of minutes.
From Mom
Scan to join the album
No app, no account
UPLOADING
Saving your moment
THE ALBUM
Emma & Jack
June 21, 2026
647 photos · 95 guests


SCAN TO TRY
pix.wedding/
your-wedding
The Headline Numbers, Sourced
US national average for a full-day wedding photography package, based on 10,474 US couples married in 2025.
View The Knot Real Weddings Study ->Zola's separately published national average for a wedding videographer, higher than The Knot's $2,300 figure because the two surveys use different samples.
View Zola's Wedding Videographer Cost Guide ->Typical UK full-day wedding photography package price band, before the 20-40% London premium noted below.
View Bridebook's UK Photography Pricing Guide ->Wedding Photography Cost Statistics
National averages, regional breakdowns, and year-over-year trends
Based on 10,474 US couples married in 2025. Source: The Knot Real Weddings Study 2025.
Includes NY, NJ, PA metro markets. Source: The Knot Real Weddings Study 2025.
Includes AZ, NM, TX, OK. Source: The Knot Real Weddings Study 2025.
Middle 50% of couples surveyed fall in this band. Source: The Knot Real Weddings Study 2025.
Smaller weddings need less coverage time. Source: The Knot Real Weddings Study 2025.
Larger weddings often need longer coverage or a second shooter. Source: The Knot Real Weddings Study 2025.
Full-day coverage, one videographer, edited highlight film. Source: The Knot Real Weddings Study 2025.
Compared with roughly 88% who book a photographer. Source: The Knot Real Weddings Study 2025.
Regional cost spread is real but more modest than couples expect.
The Knot's 2025 data puts the gap between the highest-cost US region (Mid-Atlantic, $3,800) and the lowest (Southwest, $2,600) at roughly $1,200, not the multi-thousand-dollar swings sometimes claimed online. Coverage hours, second shooters, and album add-ons move the price far more than geography alone. Always compare 3-5 local quotes before accepting a price.
Photographer Hiring Statistics
Who hires, how many, and for how long
One of the most commonly booked wedding vendor categories. Source: wedding-industry statistics roundup, Sara Does SEO, 2026.
Most full-day packages cover getting ready through the first dances; extending past 8 hours usually costs overtime.
A second shooter adds meaningfully to total coverage, most valuable at weddings above ~120 guests.
Less than half the photographer booking rate. Source: The Knot Real Weddings Study 2025.
Compared with $2,500 for Millennial couples and $1,600 for Gen X couples. Source: The Knot Real Weddings Study 2025.
Based on the $3,000 national average divided across an 8-hour wedding day. Source: The Knot Real Weddings Study 2025.
Higher overhead, travel demand, and market rates push London pricing up. Source: UK wedding-photography market data, 2026.
On a AUD $35,000 wedding, that is roughly AUD $3,500. Source: Australian wedding-cost guides, 2026.
Photo Volume Statistics
How many photos are actually taken, captured, and delivered at the average wedding
Professional coverage is only part of a wedding's photo output. Guests are shooting on their own phones throughout the day too, and our own first-party data (203 real weddings collected through Pix Wedding) shows what actually gets captured when there is a structured way to gather it.
Professional photographers shoot at high volume and cull aggressively before delivery. Widely reported range across wedding photography studios.
Industry-standard range for a solo photographer over a full day. High-volume shooters may deliver up to 1,200.
A second photographer adds meaningful coverage, most useful for weddings above roughly 120 guests.
A commonly cited benchmark for judging whether a photographer's package and price line up.
First-party data from 203 qualifying weddings on our platform. Full methodology on /wedding-guest-photo-upload-statistics.
The average is pulled higher by a small number of very large albums; median is the more typical outcome. Same dataset.
Watch: How Many Photos Should a Wedding Photographer Deliver?
Source: Photo Feaver, "How many photos should you deliver as a Wedding Photographer?"
Wedding Photo Sharing Statistics
Adoption of digital sharing tools, growth trends, and generational differences
Median 8. First-party data across 203 qualifying weddings. Full methodology on /wedding-guest-photo-upload-statistics.
Median around 17. A guest who uploads at all tends to upload a lot, not just one photo. Same dataset.
QR codes on table signage or a welcome sign are the standard low-friction way guests are pointed to a shared gallery.
Audio guestbook is a newer, opt-in feature; photo uploads remain the dominant behavior. Same dataset, /wedding-guest-photo-upload-statistics.
We do not run post-wedding satisfaction surveys, so we do not report a citable satisfaction percentage for this category.
Wedding Videography Statistics
Hiring rates, cost comparisons, and regret data
Compared with roughly 88% who hire a photographer. Source: The Knot Real Weddings Study 2025.
Zola's separately published estimate is higher, around $3,993 nationally, reflecting different survey samples. Cite the specific source when comparing quotes.
Middle 50% of couples surveyed. Source: The Knot Real Weddings Study 2025.
Compared with $2,100 in the South/Southeast and Southwest, the lowest-cost regions. Source: The Knot Real Weddings Study 2025.
Generational spending gap on videography packages. Source: The Knot Real Weddings Study 2025.
From Salt Lake City on the low end to San Francisco on the high end. Source: Zola wedding-cost data, 2026.
Guest Photo Behavior Statistics
What guests actually do with their phones at weddings
Source: 2026 Wedding Photo Sharing Report, LiveShareNow, based on 15,000+ weddings and private events on their platform.
Most guest sharing activity is concentrated immediately during and right after the event. Source: 2026 Wedding Photo Sharing Report, LiveShareNow.
Roughly 6.7 photos per contributing guest on average. Source: 2026 Wedding Photo Sharing Report, LiveShareNow. Platforms measure this differently, so treat cross-platform comparisons as directional.
Median 8. First-party data across 203 qualifying weddings. See /wedding-guest-photo-upload-statistics.
Note the LiveShareNow and Pix Wedding figures above come from two different companies' own platforms and are not directly comparable head-to-head; each measures its own users' behavior, not the wedding industry as a whole. We include both because they are the most current, named, dated sources we could verify for guest-side sharing behavior.
Disposable Camera Statistics
The analog revival: numbers behind film's comeback at weddings
Source: disposable camera market research, Global Growth Insights / DataIntelo, 2026.
Projected to reach roughly $3.1B by 2034 (6.2% CAGR). Source: DataIntelo market research, 2026.
Behind tourism at roughly 40%. Source: Global Growth Insights disposable camera market report, 2026.
A product specification of common disposable cameras (e.g. Fujifilm QuickSnap, Kodak FunSaver), not a survey figure.
Note: film-processing labs have reported slower turnaround times as the disposable-camera trend has grown demand faster than lab capacity, so budget more time for development than you might expect if you are placing disposable cameras at a wedding.
Wedding Photography Regret Statistics
What couples wish they had done differently
Multiple wedding-industry sources (WeddingWire, The Knot, and wedding-vendor blogs summarizing newlywed surveys) describe not hiring a videographer as one of the most commonly cited post-wedding regrets, and photography/videography decisions as a recurring theme in "what we would do differently" content. None of the sources we reviewed published an exact, dated percentage with a stated sample size for this claim, so we are not going to invent one here. What follows are the patterns that are consistently and honestly reported.
Skipping videography is the most frequently mentioned regret
Couples who did not book a videographer commonly say afterward that they wish they had captured moving footage and audio, especially of vows and speeches, which a still photograph cannot reproduce.
A missing guest photo collection system is a common lower-profile regret
Couples frequently mention, after the fact, that they wish they had made it easier for guests to share their own candid photos, since those photos are the only record of moments the professional photographer was not positioned to catch.
Mismatched style expectations, not price, drive photography disappointment
Wedding-vendor advice content consistently points to unclear pre-booking conversations about editing style (dark and moody vs. bright and airy, for example) as the leading source of after-the-fact dissatisfaction, more so than the amount spent.
Timing and Delivery Statistics
How long couples wait and how long their photos survive in cloud storage
A widely reported range across working wedding photography studios' own published turnaround policies.
Photographers frequently note longer turnaround in their busiest months; always confirm the specific timeline in your contract.
Reused from the photo-volume data above, relevant here because larger deliveries generally take longer to cull and edit.
Named platforms frequently used by working wedding photographers to deliver final galleries; exact gallery-expiry windows are set individually by each photographer's plan and contract, not a universal number.
A practical takeaway, not a statistic: download your gallery, do not rely on the link.
Online galleries are typically time-limited by the photographer's hosting plan, and links can lapse if a studio changes platforms or closes. We could not find a single reliable, named, dated source for "what percentage of couples lose gallery access," so we are not printing an invented number here. The safe practice regardless of the exact odds: download the full-resolution files to your own storage as soon as they arrive.
Wedding Photography Statistics by Country
US, UK, Australia, and Germany compared
United States
United Kingdom
Australia
Germany
Key Stats Summary Table
The headline figures from every section above, in one place
| Metric | Figure | Source |
|---|---|---|
| US average full-day photography package | $3,000 | The Knot Real Weddings Study 2025 |
| US average wedding videographer package | $2,300 (Knot) / $3,993 (Zola) | The Knot / Zola |
| UK average full-day photography package | £1,800-£2,800 | Hitched / Bridebook |
| Edited photos delivered, solo photographer, full day | 400-800 | Wedding photography studio norms |
| Guest photos collected per wedding (Pix Wedding) | 197 avg / 149 median | Pix Wedding internal data |
Sources: The Knot Real Weddings Study, Zola, Hitched, and Bridebook. Full methodology and additional sources below.
Methodology and Sources
Where these numbers come from and how to interpret them
The statistics on this page are compiled from the following named, dated sources. Every stat card above attributes its own specific source; this list is the full reference set:
Where figures are presented as ranges rather than point estimates, the range reflects genuine market variation reported by the source. All figures represent 2025-2026 published data. Country averages use approximate currency values as published by each source and should be verified against current exchange rates when making financial decisions. Where we could not find a credible, named, dated source for a commonly repeated wedding-statistics claim, we removed it rather than publish an unverifiable number; see the regret-statistics section above for an example of how we handled that.
How to Use These Numbers When Talking to Vendors
Turning benchmarks into a real conversation with a photographer or videographer
Knowing the national averages is only useful if it changes the conversation you have with a vendor. Here is a short, practical sequence for using the data on this page during your actual vendor search.
- 1
Anchor to the range, not a single number. If a photographer quotes $6,500 for an 8-hour package in a region where The Knot's regional average is closer to $2,900-$3,800, ask directly what is driving the premium: a second shooter, an album, extra editing hours, or simply demand.
- 2
Ask for a delivered-photo number in writing, not just "a lot of photos." Given that the reported range is 400-800 edited images for a full day, a contract that promises "hundreds of photos" without a number is worth clarifying before you sign.
- 3
Confirm the delivery timeline against the 4-8 week benchmark. If a photographer's contract states 12+ weeks outside of peak season, ask why, and get the date in writing rather than a verbal estimate.
- 4
Decide on videography early, not as an afterthought. With booking rates at roughly 37% versus 88% for photography, video is the vendor couples most often add late or wish they had booked; if budget is tight, ask photographers whether they offer a short vow-audio add-on as a lower-cost middle ground.
- 5
Plan for guest photos separately from your vendor budget. Guest-side platforms report the bulk of sharing activity happens in the first 24-48 hours after the event, so set up a QR code or sharing link before the wedding starts, not after.
A short script for the "why is this quote higher than average" conversation
"I've seen the national average for a full-day package land around $3,000, with most couples spending between $1,500 and $4,700. Your quote is above that range, which is completely fine if it reflects something specific, could you walk me through what's included that pushes it up?"
For a first-party counterpoint to the industry averages on this page, our own dataset from 203 real weddings on the Pix platform reports 197 average guest photos per wedding (median 149) with full methodology and limitations stated inline.
Related Tools and Guides
How These Statistics Were Compiled
The cost and hiring figures on this page are drawn from The Knot's 2025 Real Weddings Study (10,474 US couples who married in 2025), Zola's published wedding-cost data, the UK Hitched/Bridebook wedding reports, easyweddings.com.au Australian cost data, and Bridebook's German market pricing guide. Photo-volume ranges reflect figures commonly reported by working wedding photography studios rather than a single survey. Every figure below is attributed to its specific source in the stat card or table it appears in.
Where ranges are given rather than point estimates, this reflects genuine variation across markets, wedding sizes, and price tiers - a photographer in a major metro can charge meaningfully more than one in a smaller market, and coverage length changes the price directly. All cost figures reflect 2025-2026 published survey and market data.
Stats marked "Pix Wedding internal data" reflect anonymized aggregate trends from our own platform (203 qualifying weddings) and are directional, not industry-wide; full methodology is published on /wedding-guest-photo-upload-statistics. Where we could not find a credible, dated, named source for a commonly repeated wedding-industry claim, we removed it rather than publish an unsourced number.
Why Wedding Photography Statistics Matter for Planning
Couples who research real cost data before booking are better equipped to spot overpriced packages and negotiate with actual benchmarks in hand. Knowing the national average sits at $3,000 with a typical range of $1,500-$4,700 (The Knot, 2025), for example, gives you a reference point when a vendor quotes a price far outside that band.
Guest photo behavior is the most underused planning lever. Most couples budget only for the professional photographer and overlook the volume of additional photos guests capture on their own phones throughout the day - photos that typically stay on individual devices unless there is a structured way to collect them.
- •Photography and videography together are consistently among the top three to four wedding expense categories, alongside venue and catering.
- •Couples who discuss photo-count expectations with their photographer before signing report fewer surprises after delivery.
- •Two photographers working the same wedding typically deliver noticeably more coverage (700-1,200 edited images) than one, which matters most for weddings above roughly 120 guests.
- •Videography is one of the most frequently added services after the initial booking, and one of the vendors couples most often wish in hindsight they had booked.
The Photo Sharing Gap: A Statistic Worth Acting On
The most actionable insight in wedding photo data is not a single percentage, it is the structural gap between what a professional delivers and what guests capture. Professional photographers deliver 400-800 curated images. Guests at a 100-150 guest wedding are, collectively, taking a large multiple of that on their own phones across the day - but without an active collection system, those photos typically stay scattered across individual camera rolls and are rarely forwarded to the couple.
Wedding photo sharing platforms like Pix Wedding exist specifically to close that gap: guests scan a QR code at the venue and upload directly to a shared gallery, so the photos that would otherwise disappear into someone's camera roll get captured in one place instead.
Explore more free wedding tools
Everything you need to make your wedding day stress-free and unforgettable.
QR Sticker Designer
Design custom print-ready stickers.
Hashtag Generator
Create unique wedding hashtags.
How to Collect Guest Photos
5 methods ranked by participation rate and ease.
Get Photos After the Wedding
Message templates to gather guest photos post-wedding.
Share Wedding Photos with Guests
Compare every sharing platform by ease and participation.
Best Way to Get Guest Photos
The single method with the highest participation rate.
How to Make a Shared Wedding Album
Step-by-step setup for every platform.
Alternative to Disposable Cameras
Better, cheaper options than disposable cameras.
Wedding Photography Statistics: FAQ
Everything you need to know about our free tools and how they help your wedding day.
Aggregated wedding-industry survey data puts the figure at roughly 88% of US couples hiring at least one professional photographer, making it one of the most commonly booked vendor categories alongside the venue and catering. (Source: wedding-industry statistics roundup, Sara Does SEO, 2026, aggregating Knot- and WeddingWire-adjacent survey data.)
According to The Knot 2025 Real Weddings Study (10,474 US couples), the national average is $3,000 for a full-day package. The middle 50% of couples spend between $1,500 and $4,700, and costs scale with guest count: about $2,000 for weddings under 50 guests, up to $3,500 for weddings over 100 guests.
Wedding photography studios commonly report delivering 400-800 fully edited photos for a full day of coverage (roughly 50-100 finished images per hour shot). Photographers typically shoot 2,000-4,000 raw frames over the same period and cull aggressively before delivery. Two photographers working together often deliver 700-1,200 edited images.
Internal data from Pix Wedding is drawn from our own platform, which currently covers 203 qualifying weddings with methodology stated in full on /wedding-guest-photo-upload-statistics. We do not run post-wedding regret surveys, so we do not report a survey-derived regret percentage.
Full-gallery delivery commonly takes 4-8 weeks after the wedding date, longer during peak season (May-October) when photographers are booked back to back. Many photographers send a smaller preview or "sneak peek" gallery within 24-72 hours while the full edited set is completed.
Yes. Market research on the disposable camera category shows Gen Z consumers now make up roughly 63% of buyers, and weddings and events are cited as one of the largest use-case segments behind travel photography. Couples typically place several cameras on reception tables so guests can shoot candid, off-the-cuff photos alongside the professional coverage.